To view this context in a separate web browser, follow this link
Text Analysis – Floods, Worms, and Cattle Plague
Leave a reply
To view this context in a separate web browser, follow this link
For some time, I’ve been trying to find good workarounds to host and display geotiffs of historical maps. There are a number of options available, from Neatline/Omeka to Google Earth, to Maptiler/google hosting, to arcgis online. Unfortunately, most have significant disadvantages. Google Earth will display the geotiff as a background, but there is limited interactivity with vector data. Maptiler requires a paid account to remove its watermark and the google hosting option will likely disappear as an option this year. ArcGIS online requires access to an arc server. Depending on the size of the project, Neatline/Omeka is a good option if you have the space to host it on your own server, but its installation is not particularly user-friendly. The most intuitive option I’ve found thus far has been Mapbox. An online map styling platform that offers a GB of hosting space for free accounts, Mapbox provides a user-friendly GUI (much improved from the TillMill/Maptiler classic, though with more limited raster manipulation options) and easy integration of your Geotiff basemaps with ArcGIS Online, CartoDB, Leaflet, or simply hosting static images on your own website. Naturally, I’m sure there are a number of additional options and I’m very interested to hear suggestions and/or see examples using different methods/platforms.
Below, I’ve attached two options using a small dataset that visualizes dike breaches throughout the Rijn/Maas river region of the Netherlands during the catastrophic floodings between Dec 1740 and Jan 1741. The first is an animated “torque” map that highlights the location and timing of dike breaches. The second in Arc Online is an interactive, albeit static map that features additional information about the dike breaches (location, time of day, source of information, and the regions the breach threatened).
One issue I’ve noticed with this hosting option is that higher zoom levels distort the historic basemap. As you zoom in, the basemap resolves more clearly. I have yet to find a work around for this issue.
West Feliciana Parish at the turn of the 19th century was a region in transition. After a slow start in the late eighteenth century, West Feliciana Parish quickly became an important hub of commerce in late colonial Louisiana. Prior to the Civil War, the port of Bayou Sara was second only to New Orleans in the tonnage that passed through its harbor.
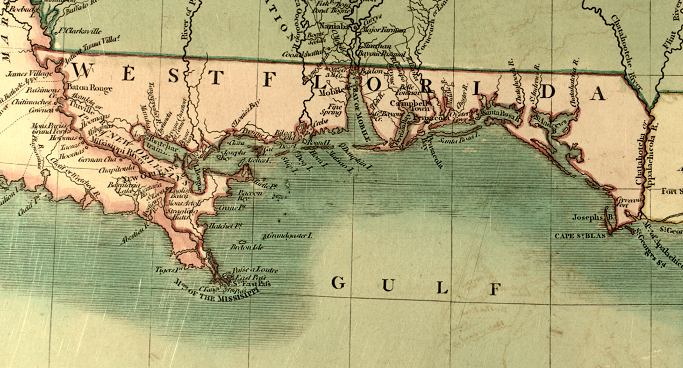
“A new map of part of the United States of North America containing the Carolinas and Georgia. Also the Floridas and part of the Bahama Islands from the latest authorities.”, Detail: 1806. Source: USF Special Collections Department
Its political situation was likewise in flux. The Felicianas (West would split from East in 1824) were part of a politically contested region of the Gulf Coast called “West Florida” stretching from the Mississippi River to the Perdido River (now the border between Alabama and Florida). The territory of the Felicianas passed through several colonial hands between the 1760s and the 1810s including the French, British, and Spanish empires. As a part of West Florida, the Felicianas were even a part of the short-lived “Republic of West Florida” before being annexed to the United States in 1810.
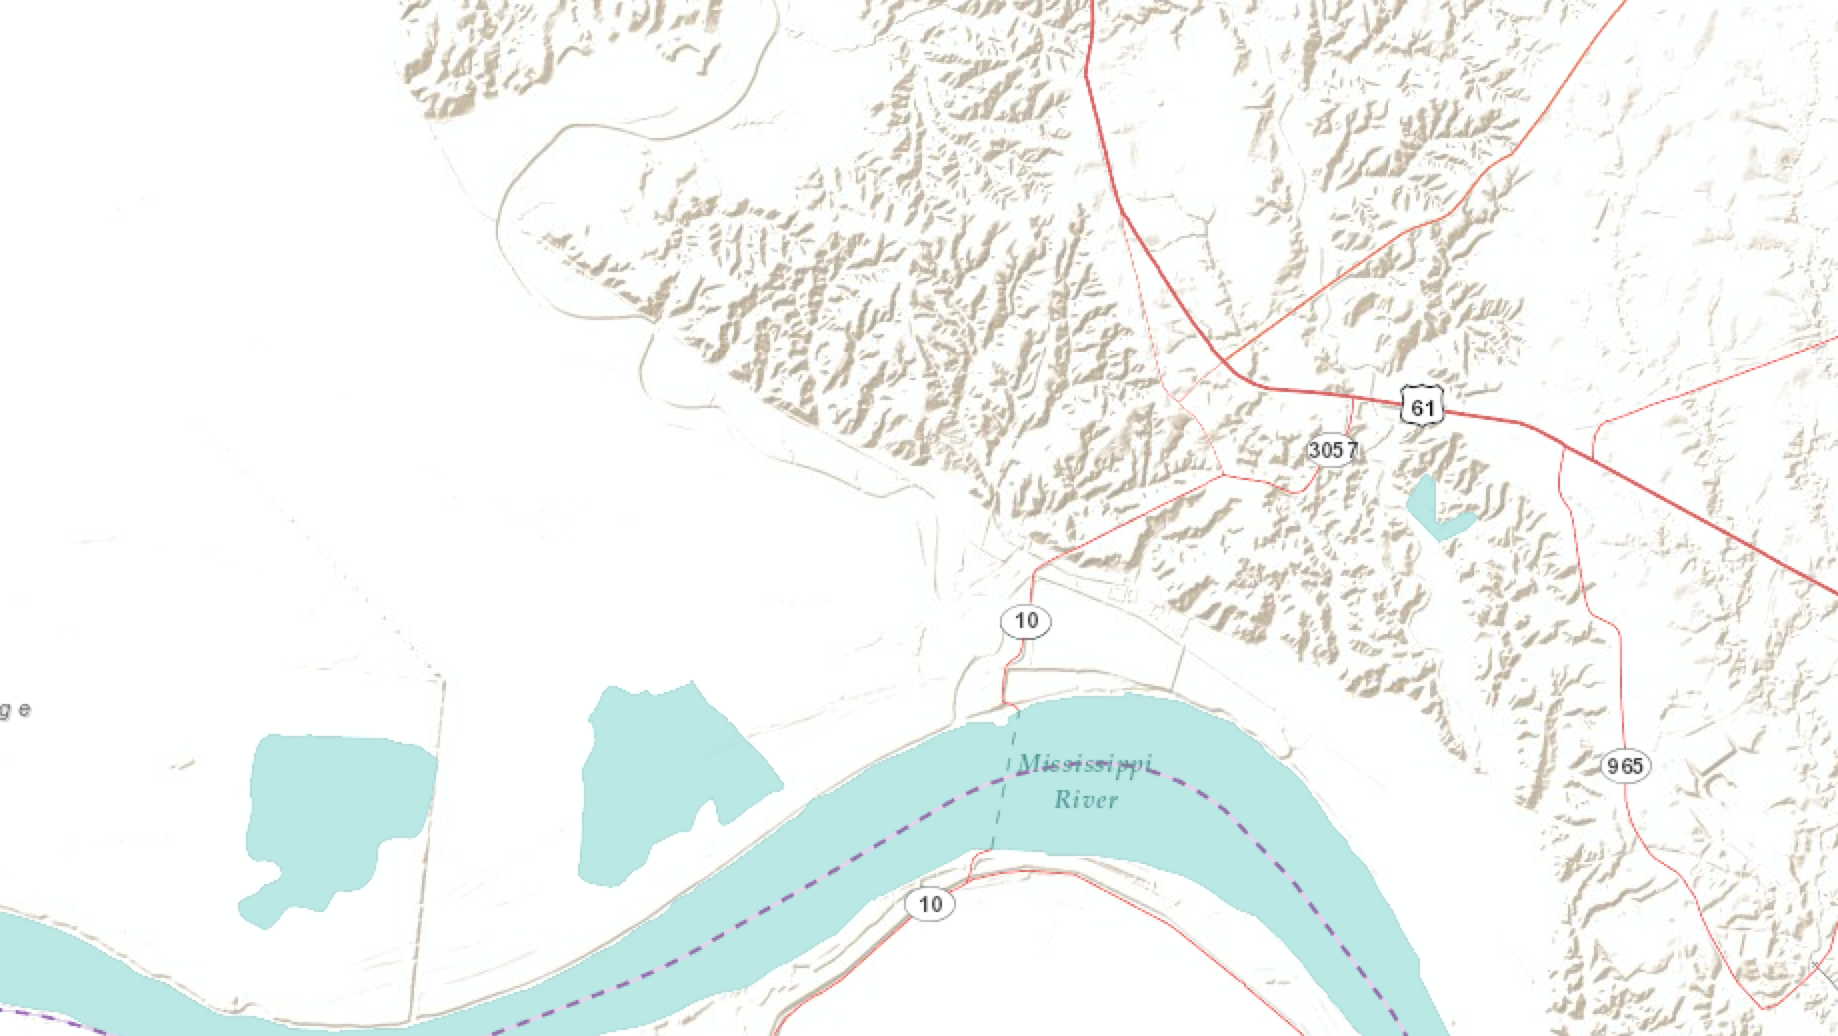
The Bend of the River near Bayou Sara highlights the stark difference between the alluvial floodplains along the Mississippi River and the loess bluffs of West Feliciana Parish.
Finally, West Feliciana’s environment is a study in contrasts. Its western border hugs the Mississippi River and a cursory comparison of modern and old plat maps confirms how dynamic and this relationship has been. Alluvial floodplains flank the river and swamps creep into the interior of the parish. Much of the parish sits on a thick loess cap (the parent material for soil) that rises abruptly from the river’s floodplains before slowly tapering off to the east.
West Feliciana Parish’s colonial and environmental past warrants investigation and GIS offers a useful tool to manage its complexity. This web mapping product is a prototype for a larger project that will explore the environmental, economic and social development of West Feliciana. “Mapping Rural Development in Early Louisiana” will document the evolution of West Feliciana Parish from colonial times up to the Civil War and highlights changes in settlement, economy and culture in the region. This post documents recent work conducted by myself, Dr. Sara Sundberg of the University of Central Missouri, and the assistance of undergraduate student Miranda Lonsdale at Creighton University.
As a first step of this project, we were curious how much early American records could reveal about colonial settlement patterns. When West Feliciana Parish passed into American hands, the new American government was faced with the difficult task of managing their new lands and confirming the rights of prior settlement. Colonial settlers had made claims to West Feliciana lands as early as the 1780s, some under British, some under Spanish governments. The US government endeavored to honor those claims by appointing a land commissioner to confirm the colonial land titles and preserve profitable, legal settlement. Commissioners presented this evidence, including earlier titles and surveys to congress.
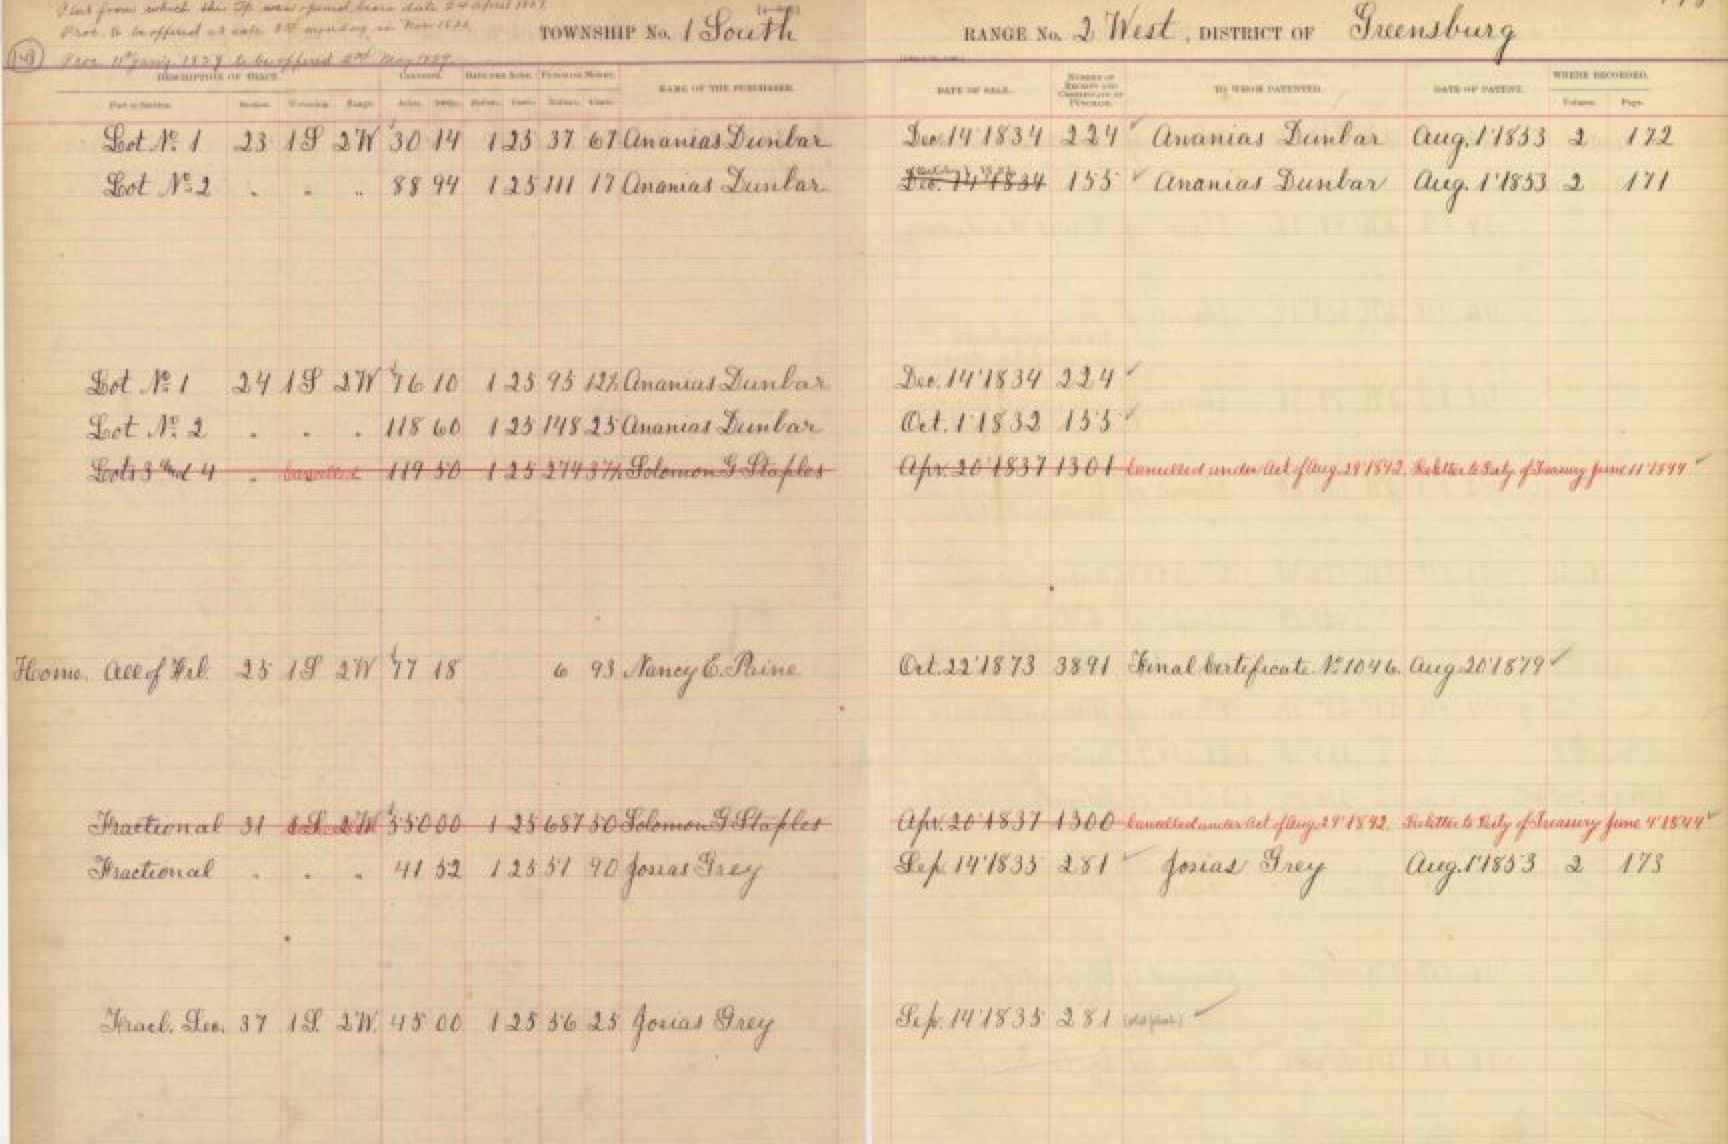
US Tract Book Vol 4, Page 148 (Greensburg District)
As a result, historians have a number of different sources available to them to reconstruct early settlement including plats (survey maps), land claims documentation (evidence of settlement and/or purchase), tract books (record book of sold or granted property), and the American state papers (the records of the congressional confirmations). We used three of the four sources for this stage of the project, all of which were available via the LA State Records Office or the Library of Congress. The American State Papers provided information about original claimants as well as the petitioners for US grants. US Tract books housed in the Parish courthouses and available online were handwritten accounts that were directly tied to information gathered in the field and often corresponded with the textual and geographic information offered on plat maps. These plats were organized according to the Township and Range system even though a large portion of West Feliciana Parish was already claimed and would not become public lands.
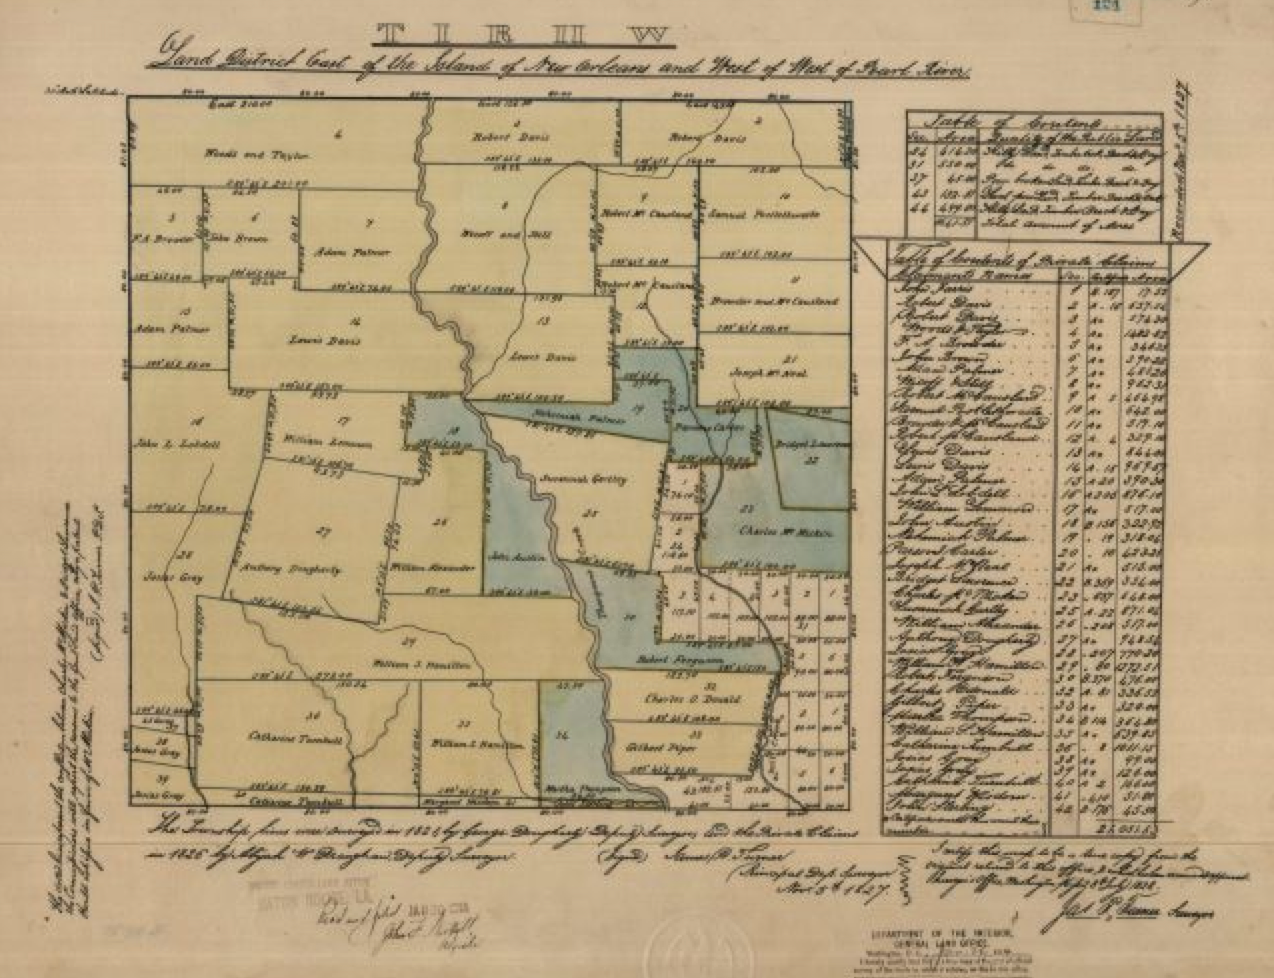
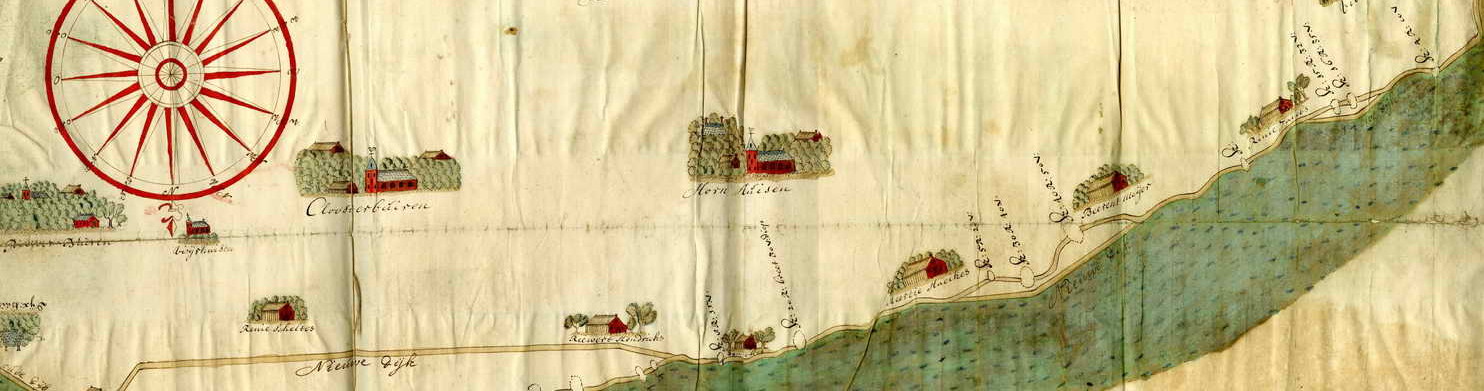
Old Plat Map for District Greensburg T1S R2W. Plat maps typically show economically useful information, such as roads, waterways, and property lines. Older plats typically include notes from the surveyors and the table to the right includes the current resident, section number, and the land parcel area.
The principal questions at this stage of the project were largely methodological. To what extent could these sources trace the early settlement history of the region? The results are promising, though not without issues. This first map highlights the date of original colonial claims made in West Feliciana. The earliest was in 1787 during the Spanish period and latest came in 1812 during the American period.
This map is interactive. Click on the individual sections to uncover the information available from these sources. The popups include links to the American State Paper images from which much of the information was derived.
One thing that is striking about this data is the number that have no original claim information. This is not surprising considering the fragmented nature of the records and because a sizable number of claimants were squatters.(1) This disparity is apparent if you compare a map of preserved Colonial claims to a map of those claims confirmed by congress.
Many more records remain that note confirmation than claims. While this is not surprising in itself for the reasons mentioned above, the degree to which you can see this difference is glaring and may prove problematic for a robust analysis in the future.

British Grant – Greensburg District pgs 1-362, A3
Where does this leave us? In addition to confirming the absence of claims data in the American State Papers, we can now turn to the actual land claims documentation used by the American government to confirm land titles. These include not only claim information but in some cases the actual British or Spanish land grants themselves. Luckily, many records have been digitized and are available through the Louisiana State Land Records Office. Other are available at the Library of Congress. Still more records may be found in England or Spain, though we have yet to explore this possibility. While not nearly as systematic as the tract books or American state papers, these sources may be the best places to turn to find out the identities of these elusive early pioneers of West Feliciana Parish.
1) Carolyn French, Land Survey and Land Acquisition in the Florida Parishes of Louisiana, Man and Environment in the Lower Mississippi Valley (1978) 111-121).
 You can find an interactive story map of my research trip here.
The journey is ending. After a month of research and travel throughout the Netherlands and two international conferences, I am looking forward to some stasis. I have almost become used to this nearly constant motion, but somehow the pace of this last week seemed to have increased. (The below map highlights the locations of archives and conferences visited over the last month)
I have now been in the The Hague for about a week. Much of this time has been spent at the Koninklijke Bibliotheek (National Library) or the National Archives. One of the most fantastic things about these resources is their proximity to one another. They are literally connected to each other and both lay a short walk from Den Haag Centraal train station. It’s a researcher’s dream to have this kind of easily accessibility! The National Archives and Library contain a fantastic amount of useful information for my research and this was only the latest in a long series of visits to the collections. The National Archives, for instance, contain almanacs, patent applications, maps, and one of the best single collections of shipworm-related documentation in any archive. While the NA has busily digitized many of their records (particularly the West India Company records) over the last several years, most of the materials I use must be obtained in person.
The National Library contains many of the hard-to-find books (early modern or otherwise) I’ve used in my work. The KB has undertaken a series of digitization initiatives since my first visit in 2010, and much of the work that used to take days in the readings rooms, can now be undertaken at home in the US. Delpher, for instance, offers a full text (though imperfect) selection of newspapers, articles, and other digital material as long as once has a subscription to the KB library. One can also access the TEMPO database (The Early Modern Pamphlets Online) of Dutch language pamphlets using the same account. All the same, this new accessibility only scratches the surface of the resources available at the KB.
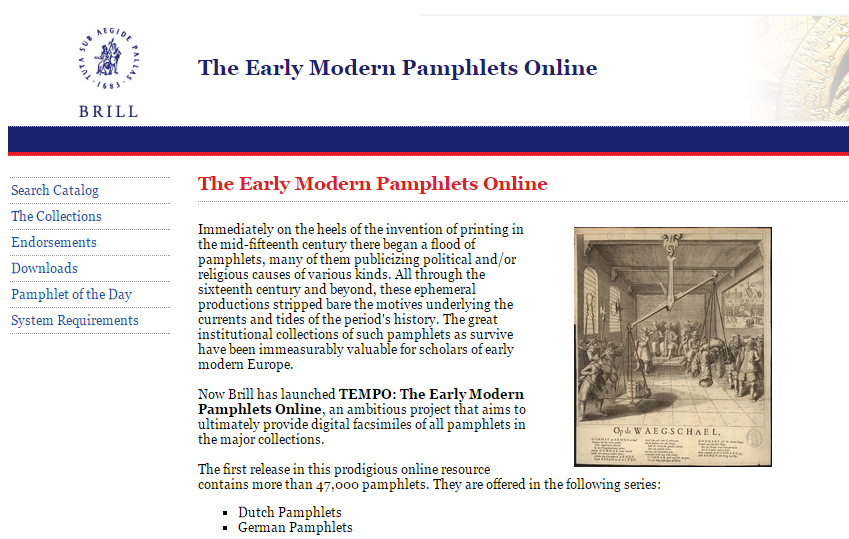
TEMPO (The Early Modern Pamphlets Online) is a digital clearinghouse of over 47,000 pdf copies of Dutch-language pamphlets.
Working at the NA and the KB also allows easy access to archives elsewhere in the Netherlands because of its proximity to the train station. On my final day in the national archives, for instance, I digitized my last document in the morning. I had been researching the third outbreak of cattle plague in the Netherlands which lasted for much of the last quarter of the eighteenth-century. A colleague I had met in Brussels and I had discussed a possible collaboration and publication comparing the Dutch and Belgian contexts of this epidemic. We are interested in the variability of mortality among cattle populations across space. Naturally, the mapping implications of this project are exciting, but first the data. Cattle mortality records are scant, but tax records (including hoorngeld or a tax on heads of cattle) were well-documented, printed, and available in the National Archives. Based on this archival work, I realized the other locations held equally useful documentation of this disease outbreak, including the North Holland Archive in the city of Haarlem.

The Janskerk location of the Noord Hollands Archief is in a former monastery originally established in the 14th century.
The North Holland Archive (Noord-Hollands Archief) is easily one of the more interesting looking archives in the Netherlands. Just like Zeeuws Archief in Middelburg, it’s a fantastic blend of early modern and contemporary architecture. The archive is actually split between two locations, the first at St. Janskerk near the main square of Haarlem, and the second just outside the center. The trip takes less than an hour, and even though I arrived at noon, I had a fantastic opportunity to access many of the records I needed.

The inventory of
The archives of the Hollandsche Maatschappij der Wetenschappen (Holland Academy of Science) lie in the other locations of the NHA in Haarlem. This was the first scientific society established in the Netherlands (a relatively latecomer by European standards, having only begun in 1752). When writing my dissertation, I became aware of the Academy’s interest in cattle plague. As an “enlightened” academic organization, the Holland Academy sought to foster “useful” knowledge for the improvement and well-being of society. The society funded research and offered prizes for the scholarly contributions that could address ongoing issues. This included cattle plague. In 1760, for example, the Academy offered a prize for anyone who could answer the questions “What are the natural origins of the cattle plague? Why is this cattle plague lasting so much longer than previously [there was an earlier epidemic in 1713]? And what are the best precautions to take to avert it, whether in the stalls or when the sickness reaches neighboring lands?” I had come across these questions (and some of the answers to these questions) in many of the pamphlets and medical treatises written about the second outbreak of cattle plague. This was an opportunity, however, to see the undistilled interaction between the Academy is participatory science. Like with most quick visits to archives, I left with a mild feeling of disappointment, not because I hadn’t found anything, but because I had found too much.
In a sense, this final experience in the archives of Haarlem was a fitting coda to a productive (if at times harried) research trip. Of course I didn’t have enough time to see everything I wanted. One rarely does. Closure and a sense of finality aren’t often the products of historical research. I did get the majority of what I needed, and more importantly, my visit opened up the possibility of future research opportunities as well.
Tot volgende keer.
It seems inevitable after every major conference that discussion quickly turns from the relative merits of the previous days’ panels, papers, and presentations to the event as a whole. Was the conference a success? What were the major trends during the conference? Which schools were most heavily represented? Which subjects received the most attention and which seemed strangely absent? Oftentimes, these discussions consist of vignettes and impressions and generally self select for the topics and time periods most regularly attended by discussants. Following the recent Annual Conference of the American Society for Environmental History, for instance, a group of KU scholars held an informal debriefing session for those who couldn’t attend the conference. We noted the strength of maritime history, the prevalence of sustainability as a core concept, and the relative lack of non-20th century and non-US presentations. As useful as the exercise was to gauge others’ opinions about the event, many of us went to the same panels and even our collective impressions could not begin to capture the breadth of the conference.
Environmental historians have also experimented with podcasts as a way to expand beyond the limitations of self-selecting departmental or informal exchanges. The Network in Canadian History & Environment (NiCHE) podcast entitled Nature’s Past: Canadian Environmental History published a retrospective appraisal from seven participants of the second World Congress for Environmental History in 2014 in Guimarães, Portugal. The podcast panelists came from various institutions in Canada (and one from the UK) and included one PhD candidate. Like more informal exchanges, the panelists tended to focus on core themes related to their interests and the diversity of voices in this discussion brought an impressive degree of breadth as well.
Depth is the strength of both informal and composed conference debriefings, but especially for those of us without decades of repeated attendance at these conferences, breadth is often wanting and the “trends” frequently discussed during these debriefings seem to exist outside of time. Can we say with any specificity when, for instance, “sustainability” or “the anthropocene” entered the discourse of these meetings, or more importantly, how they’ve changed over time? These are interesting questions because they reflect the growth, maturation, and development of the field. With the right tools, it may be possible to map out these trends.
As part of my exploration of online text analysis tools, and using the digital archive of ASEH conference programs (which extend back to 2003) I will begin working through this material, beginning with the 2015 program in DC. Using one conference program will not offer insight into multi-year trends (this will be addressed in future posts), but it will offer a chance to explore some of the strengths and weaknesses of using voyant tools for such a limited amount of data.
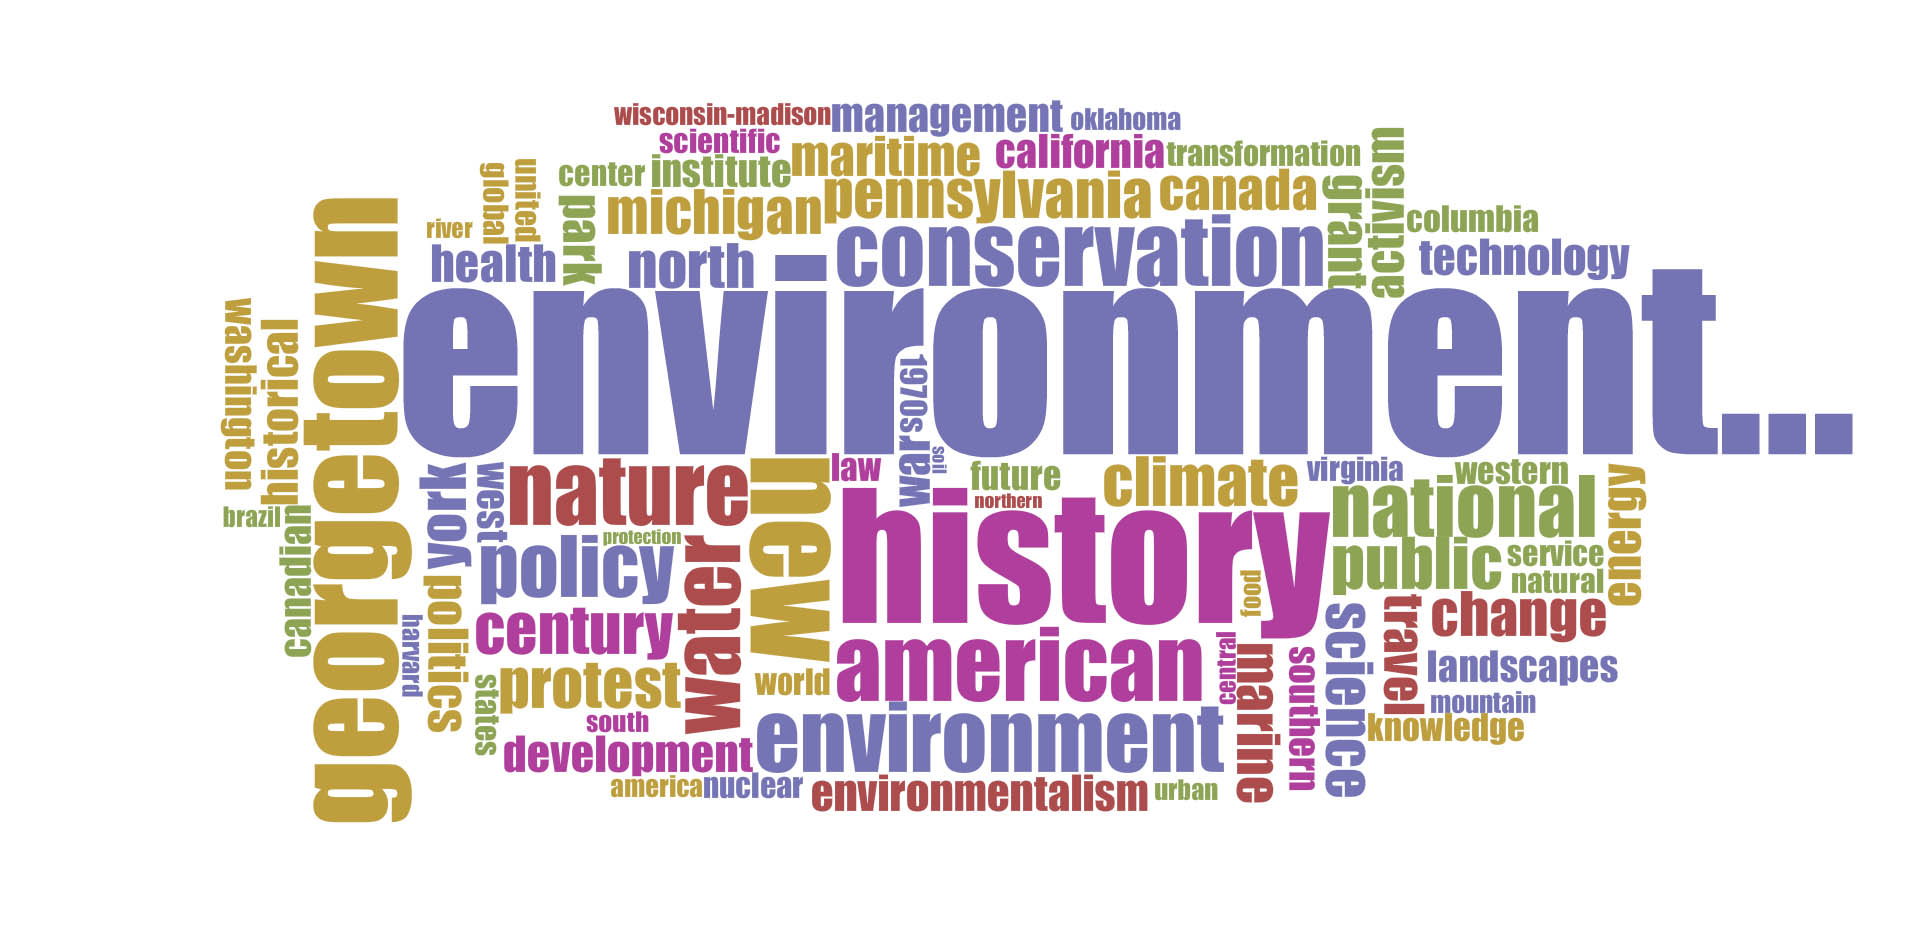
From just a cursory evaluation of one conference program we find very few surprises. Naturally, “environment” (85) and “history” (51) dominate in total word count. These are quickly followed by “Georgetown,” (32) the host of the conference, “American,” (27) and “conservation” (22). If one polled participants about which terms might be the top five most likely words to appear in the conference program, my hunch is that these might be some of their choices (with conservation perhaps the exception). At the same time, this “top five” is also somewhat misleading. Voyant cannot differentiate between words used in one context or another. “Georgetown” was the name of the host university, but also the name of two rooms used by the conference. In reality, 18 of the 32 uses of “Georgetown” referred to the room rather than the school.
This type of problem extends to other schools as well. If one were curious about university participation in the conference, for instance ranking it according to number of appearances in the program, voyant is a somewhat clumsy tool. (see list below) “Pennsylvania,” which occurs 14 times, might refer to The University of Pennsylvania (7), Pennsylvania State (3), of Pennsylvania State-Berks (2) or be included in conference papers, posters, etc. Voyant seems to offer a snapshot of some of the most heavily represented state names in the program, but this shouldn’t be mistaken for institutions. “Washington” might refer to one of three schools attending from Washington state or Washington University in St. Louis and “York” might refer to York University (3), NYU (7), SUNY at Stony Brook (1), CUNY (1), or SUNY at Binghamton (1). These are common problems when working with this tool and it’s one of the main reasons why it pays to have a large corpus for analysis. At the scale of one conference program, this type of information is easily gleaned using simpler tools.
On the other hand, voyant offers a useful global perspective on even a relatively small corpus like this. I expected “conservation” to be a prominent subject considering its traditional importance in EH, but I would not have expected it to be the fifth most used, more prominent than “nature,” “environment,” “water,” or even “policy” (ostensibly the conference theme). What might this focus reveal about the state of the conference more broadly? Voyant does not offer ready explanations on this scale.
The global perspective on a small corpus like one program is also its chief drawback. It is difficult to parse any convincing relationships with so little data. Voyant’s reputation relies less on its visually appealing word clouds than its ability to visualize word relationships using a number of supplemental tools. For instance, one can use the “word trends” tool to chart the frequency of a term against others over time (in this case, segments of the conference program), but this can lead to as many false associations as positive ones. For example, “Wisconsin-Madison” and “marine” show surprising symmetries across the program, indicating a possible relationship.

Does this indicate that Wisconsinites disproportionately favored topics in marine history? In fact, no papers or posters dealt with marine topics. This apparent relationship may have been random, or it may have been the result of some other factor not included in the analysis. Another Voyant tool graphs “correspondence” between terms on a scatter plot, identifying potential spatially organized clusters of word relationships.
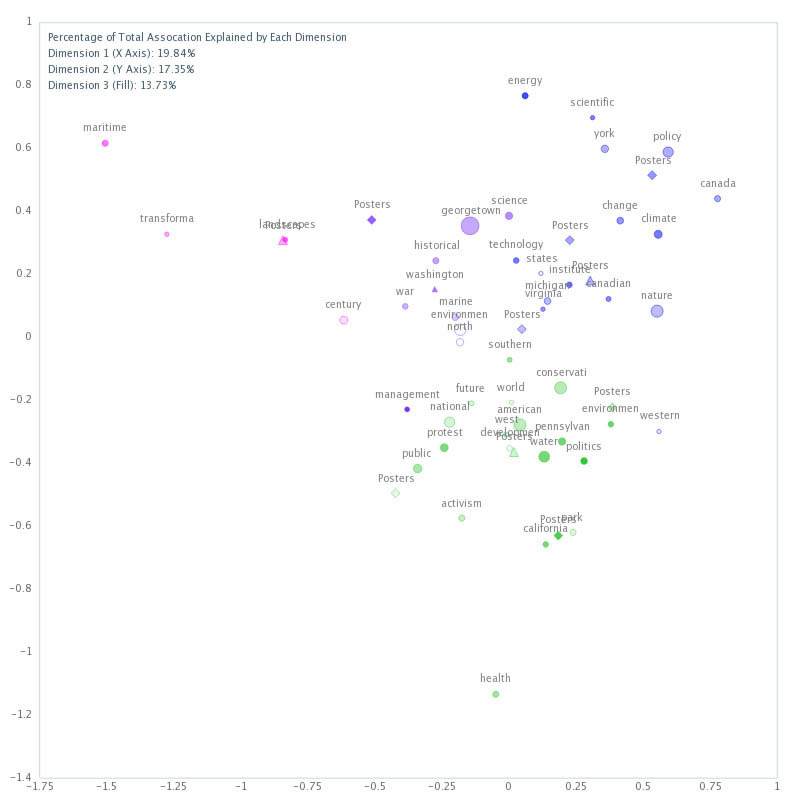
Once again, this visualization shows several potential relationships, though none of them strong. Some more obvious relationships include “climate” and “change,” “american” and “west,” and “protest” and “activism,” which appear clustered together. “Science” and “technology” is somewhat less closely clustered. “Pennsylvania” and “water” are also spatially clustered, but only one participant from a Pennsylvania school presented a paper on a “watery” topic (Jason M Chernesky’s “Amusement, Health, and the Therapeutic Environments on the 19th-Century Delaware River”) and “water” was not even included in the title.
On the scale of one program, therefore, we see the benefits and problems of using voyant as a tool of analysis. Voyant quickly and easily offers a global picture of the conference based on word frequency. The takeaway from the KU post-conference debrief was that “sustainability” and “marine” topics were surprisingly common. “Marine” appeared a respectable 13 times, but “sustainability” only had 4 mentions. None of us mentioned the prominence of “conservation” as a topic (and one our own even presented on it). Voyant’s mastery of breadth here offered an interesting new look. This might inspire someone to take a close look at, for instance, what sorts of conservation topics participants presented on during the conference. Were they progressive era or later twentieth century? Did they discuss terrestrial or marine conservation? American or non-American? Voyant could offer insight into these questions as well, but it would likely be a clumsy tool compared to more direct approaches.
Universities (number of mentions):